Methodology Behind Score Sensei's Football (Soccer) Predictions
At Score Sensei, we use a simple methodology to generate win/loss/draw probabilities and other insights for upcoming football (soccer) matches. Here's an overview of how our model works:
Data Sources
We gather extensive historical data using worldfootballR to build a comprehensive dataset of past match results, including details like date, competition, home and away teams, scores, etc. This allows us to analyze over 10 years of match data across many top leagues and competitions worldwide.
Team Strength Ratings
A key component of our model is creating offensive and defensive ratings for each team that quantify their goal-scoring and goal-preventing abilities. We use Poisson distributions along with the historical match data to estimate these ratings, which are dynamic and update as new matches are played.
Expected Goals
Using the team strength ratings, we can calculate expected goals for each team in an upcoming match. This tells us how many goals we'd expect each team to score based on their ratings. We combine multiple expected goal metrics using different samples of historical matches to improve accuracy.
Simulation Model
Once we have expected goal totals, we run thousands of Monte Carlo simulations for each match. In each simulation, we randomly draw goal totals from Poisson distributions using the expected goals. Summing up wins, losses, and draws across all simulations gives us win/draw/loss probabilities.
Additional Factors
On top of expected goals and simulations, we also incorporate factors like home advantage, league strength, recent form momentum, and more. This gives us a complete picture of influences on match outcome.
Exploring Advanced Stats (xG)
For leagues where advanced stats like expected goals (xG) are available, we are looking to integrate these metrics into our model in the future. xG data will allow us to further refine our team strength ratings.
By combining statistical modeling with simulation and relevant contextual factors, our methodology generates probabilistic match predictions. We're constantly tweaking and improving our model as new data comes in. Please check out Score Sensei to see our latest football (soccer) predictions and insights!
Model Performance
This page displays the model performance for the current season, focusing on European first-flight and second-tier leagues. These leagues are integral to our predictive model and help us provide accurate match predictions.
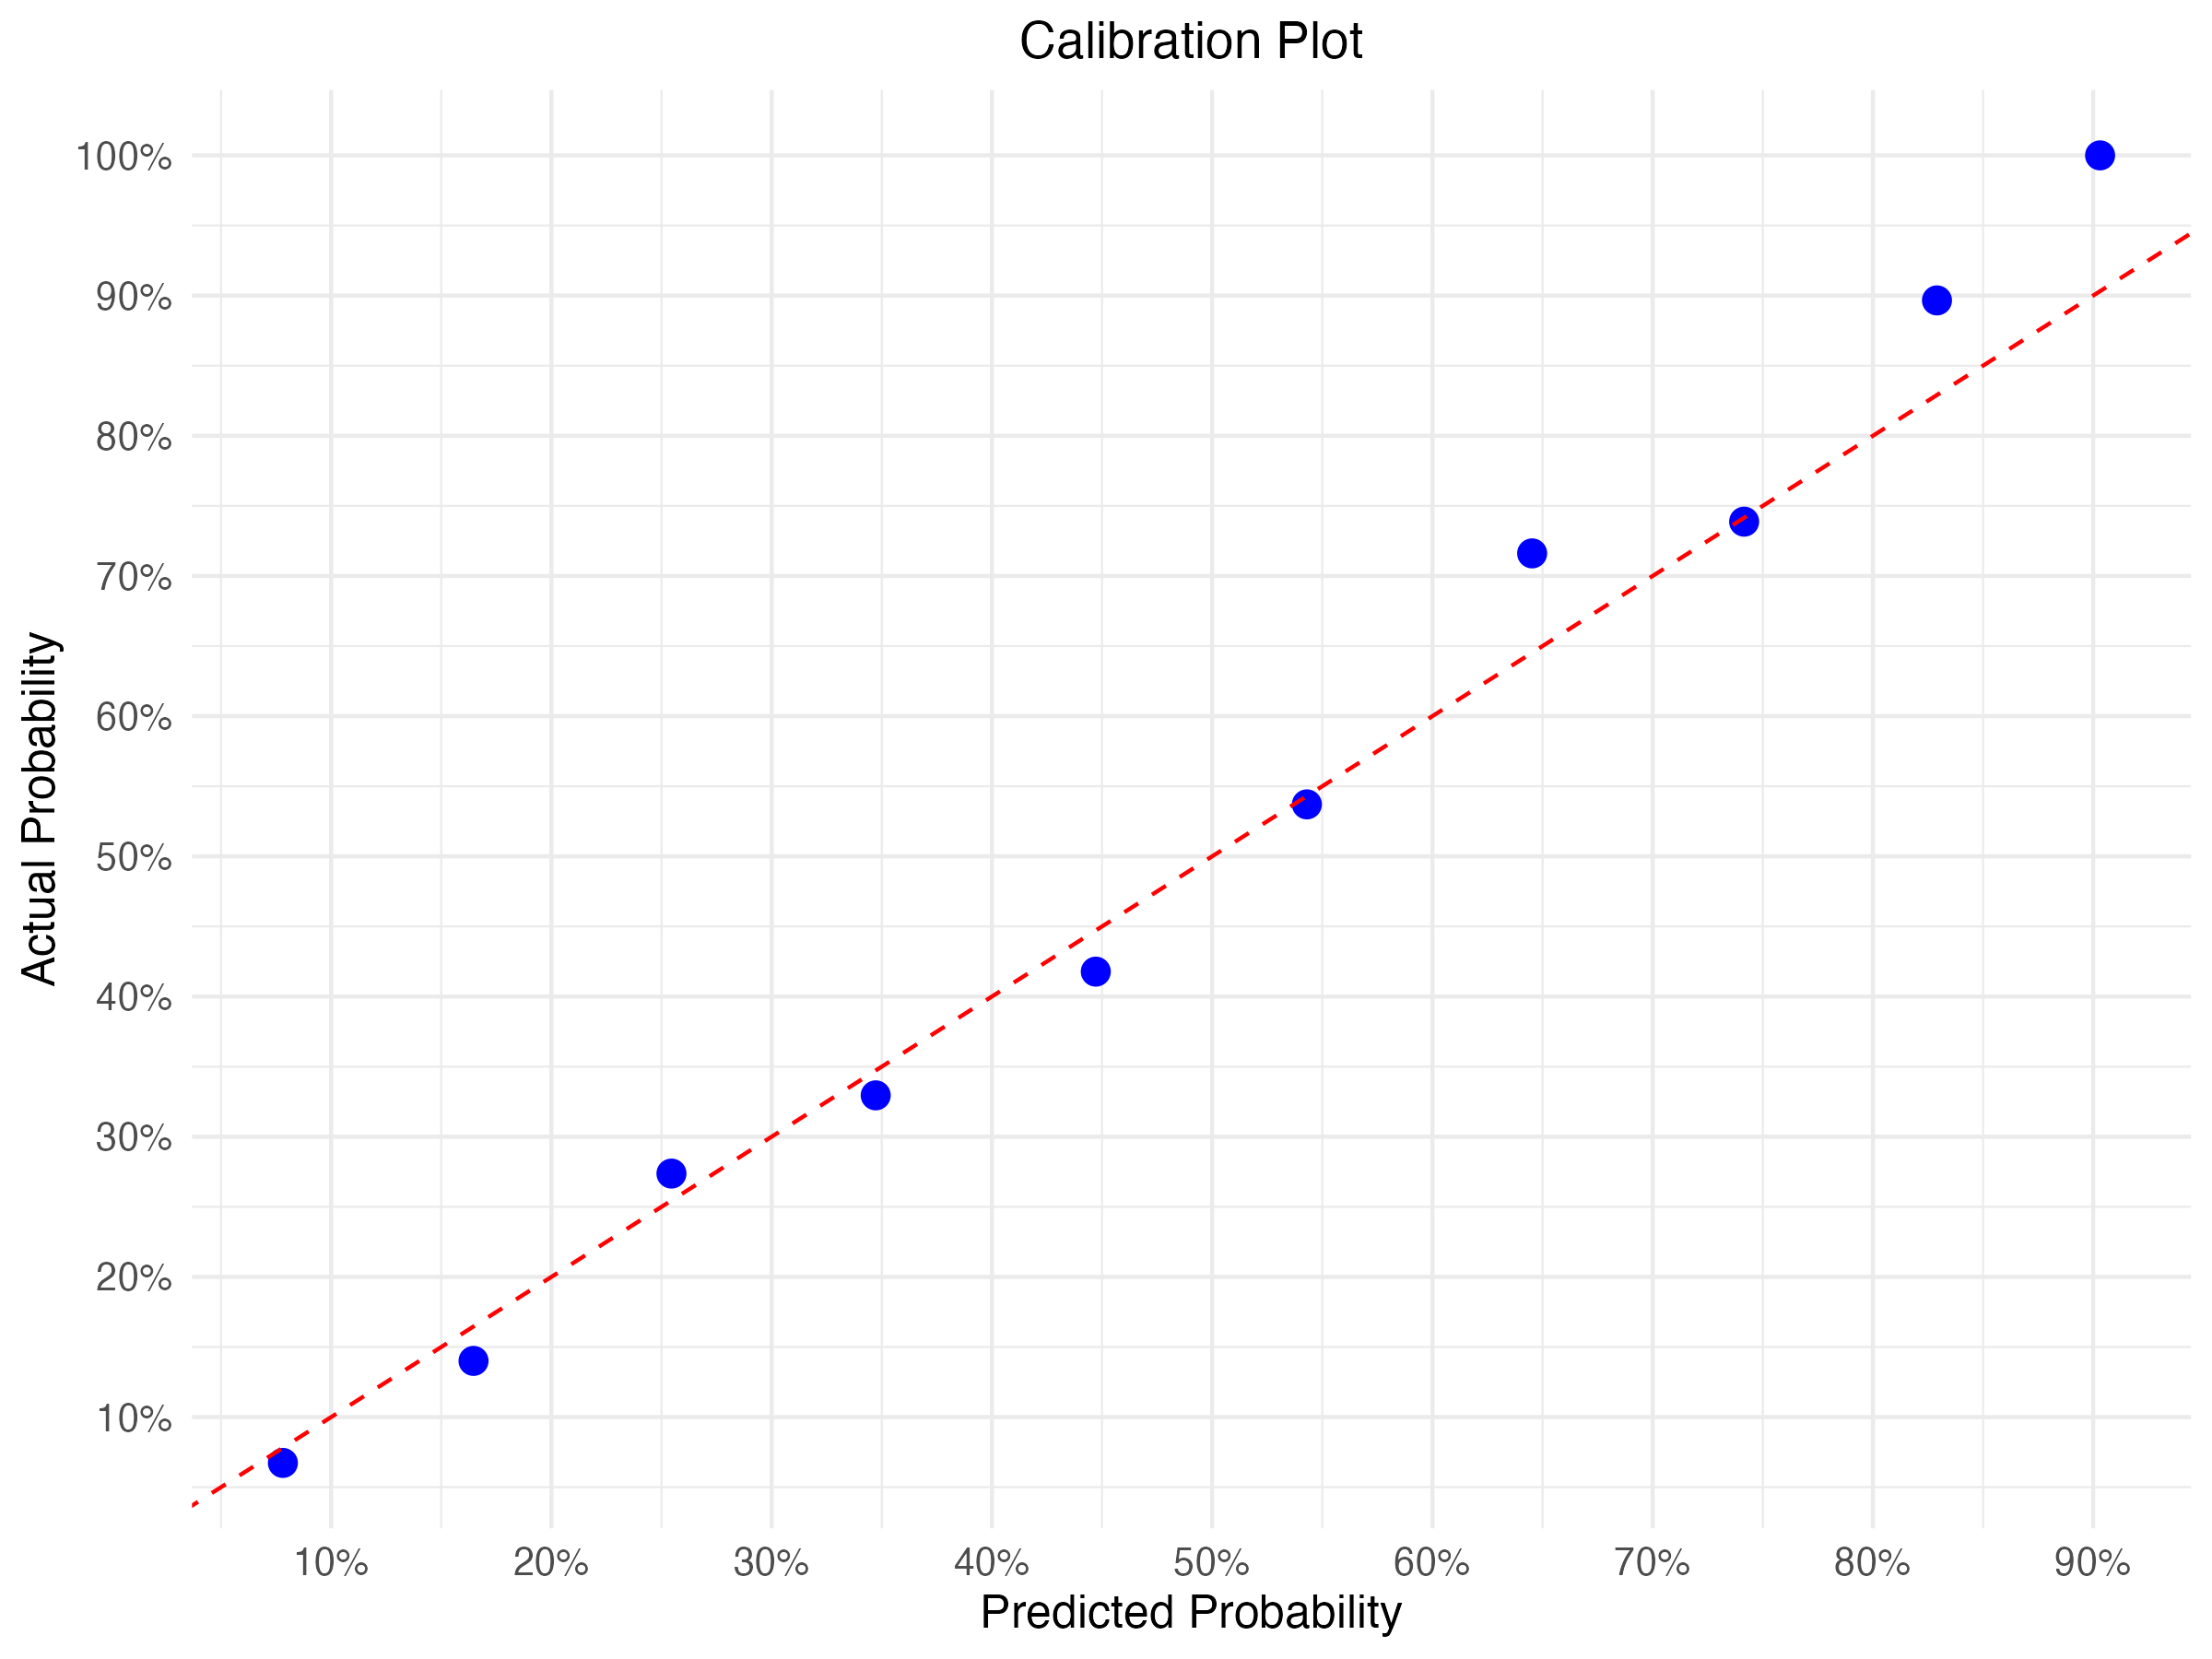
Our approach emphasizes transparency, and the calibration plot below showcases how our predicted outcomes compare to actual results. Each bin represents a range of predicted probabilities, and the plot illustrates how often the actual outcomes fall within these ranges.
By analyzing the calibration plot, users can gauge the reliability of our predictions and understand any potential biases or inaccuracies in the model. We continuously refine our methodology to improve accuracy and provide valuable insights to football enthusiasts.
European Leagues Included in the Calibration:
- La Liga
- Ligue 1
- Premier League
- Serie A
- Primeira Liga
- Bundesliga
- 2. Bundesliga
- Ligue 2
- EFL Championship
- Serie B
- Segunda División

Expected Goals Model Performance Metrics
The following table summarizes the performance of different predictive models. The models have been evaluated based on Log Loss, Brier Score, and Rank Probability Score (RPS). Additionally, we have compared the standard models with their expected goals (xG) counterparts to understand the impact of xG on model performance.
Expected goals (xG) measures the quality of a scoring chance based on factors like the type of assist, angle, and distance to goal. Using xG metrics improves model accuracy, especially for leagues with significant xG data history (3 or more years), as depicted below:
| Model | Log Loss | Brier Score | Rank Probability Score |
|---|---|---|---|
| Recency | 0.6167301 | 0.2105630 | 0.4350659 |
| Recency.xg | 0.5934173 | 0.2027280 | 0.4151345 |
| Adj Goals | 0.6101010 | 0.2084457 | 0.4299656 |
| Adj Goals.xg | 0.5886517 | 0.2006695 | 0.4097635 |
| Momentum | 0.6540947 | 0.2201641 | 0.4610323 |
| Momentum.xg | 0.6047770 | 0.2070574 | 0.4284204 |
| Basic | 0.5932838 | 0.2029726 | 0.4158680 |
| Basic.xg | 0.5929648 | 0.2028705 | 0.4145138 |
| Global | 0.5885199 | 0.2006487 | 0.4100453 |
| Global.xg | 0.5889827 | 0.2010117 | 0.4105521 |
| Rated | 0.5996256 | 0.2056399 | 0.4244355 |
| Rated.xg | 0.6116805 | 0.2060495 | 0.4255521 |

Roadmap
Calibrate the xG model to update it to version 0.4 and use it for leagues that have 3 or more years of xG data available.
Working on a sample player performance visualization for the Colombia national team.
Recent Changes (March 2025)
- We have included our first iteration of team and league ratings based on our model offense and defense scores. For now, the overall or net rating is calculated as offense minus defense.
Recent Changes (September 2024)
- Updated model to v0.3 which adds more weight to the 5 most recent matches.
- Included Belgian and Dutch leagues in the model.
- Updated model to v0.2 to fix home status advantage issues on neutral grounds.
Recent Changes (June 2024)
- Changed commenting system due to issues with the prior provider on mobile devices.
- Included Belgian and Dutch leagues in the model.
- Updated model to v0.2 to correct home status advantage on neutral grounds.