Model Performance
This page displays the model performance for the current season, focusing on European first-flight and second-tier leagues. These leagues are integral to our predictive model and help us provide accurate match predictions.
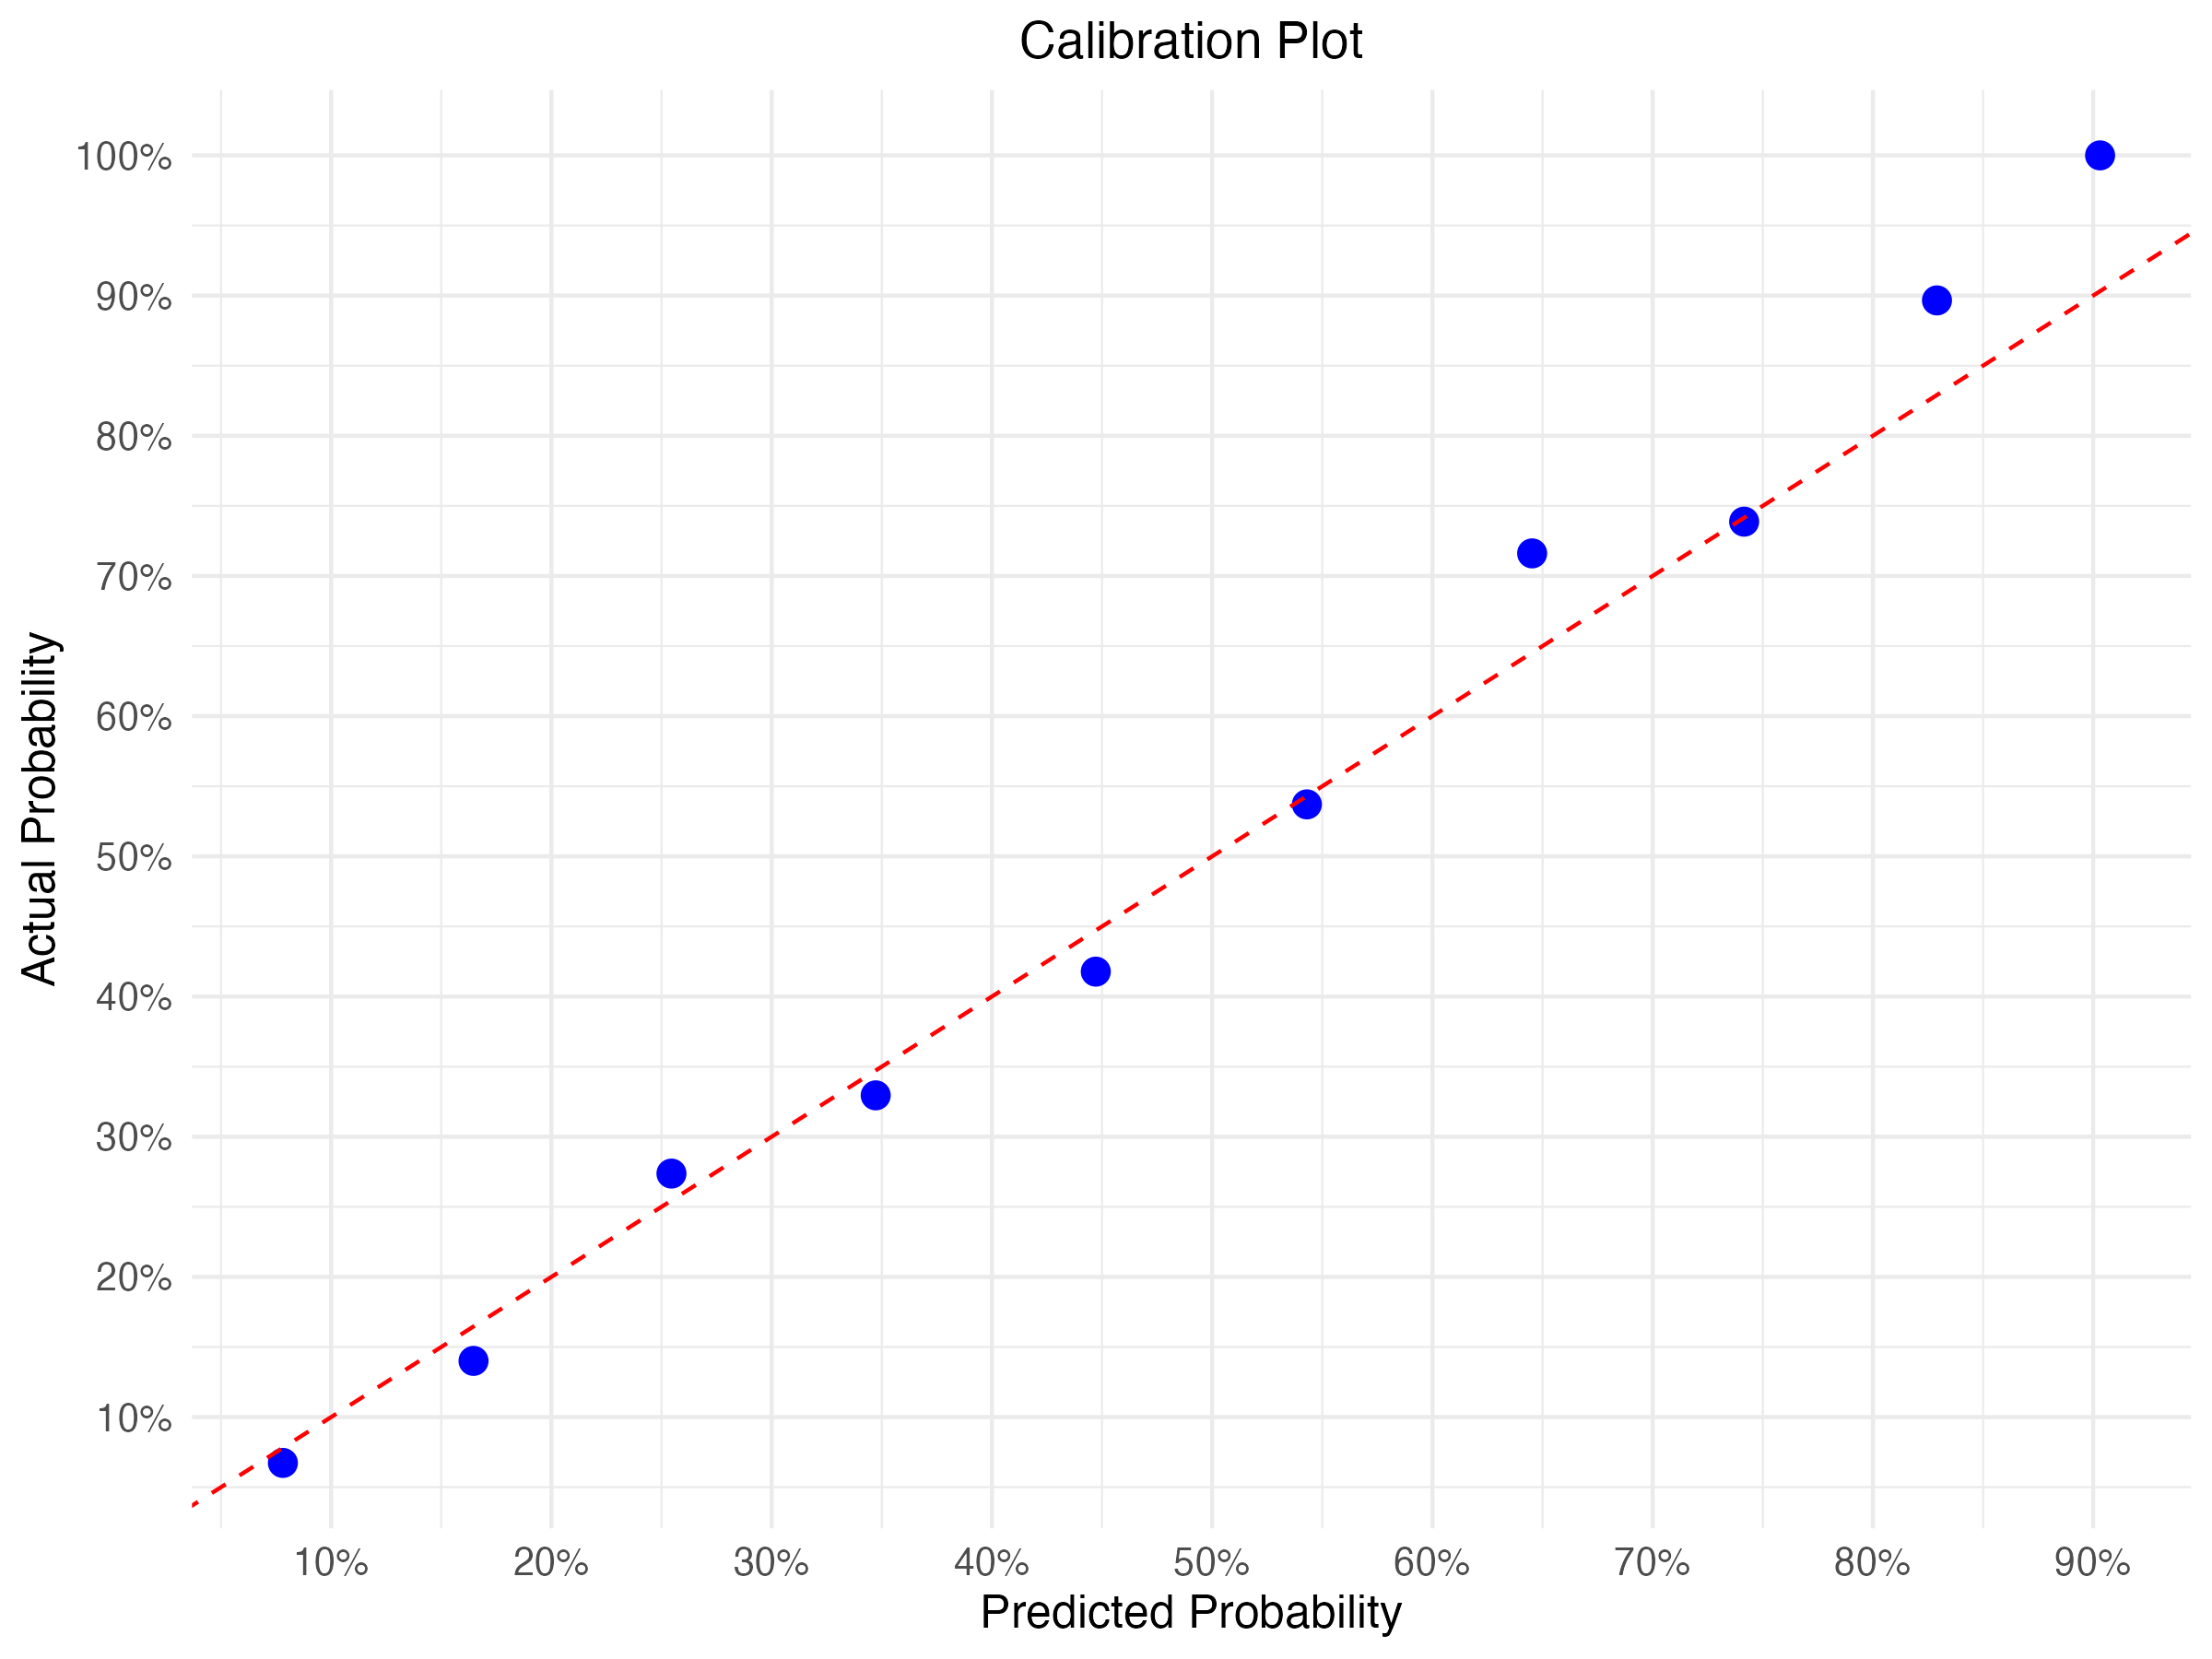
Our approach emphasizes transparency, and the calibration plot below showcases how our predicted outcomes compare to actual results. Each bin represents a range of predicted probabilities, and the plot illustrates how often the actual outcomes fall within these ranges.
By analyzing the calibration plot, users can gauge the reliability of our predictions and understand any potential biases or inaccuracies in the model. We continuously refine our methodology to improve accuracy and provide valuable insights to football enthusiasts.
European Leagues Included in the Calibration:
- La Liga
- Ligue 1
- Premier League
- Serie A
- Primeira Liga
- Bundesliga
- 2. Bundesliga
- Ligue 2
- EFL Championship
- Serie B
- Segunda División
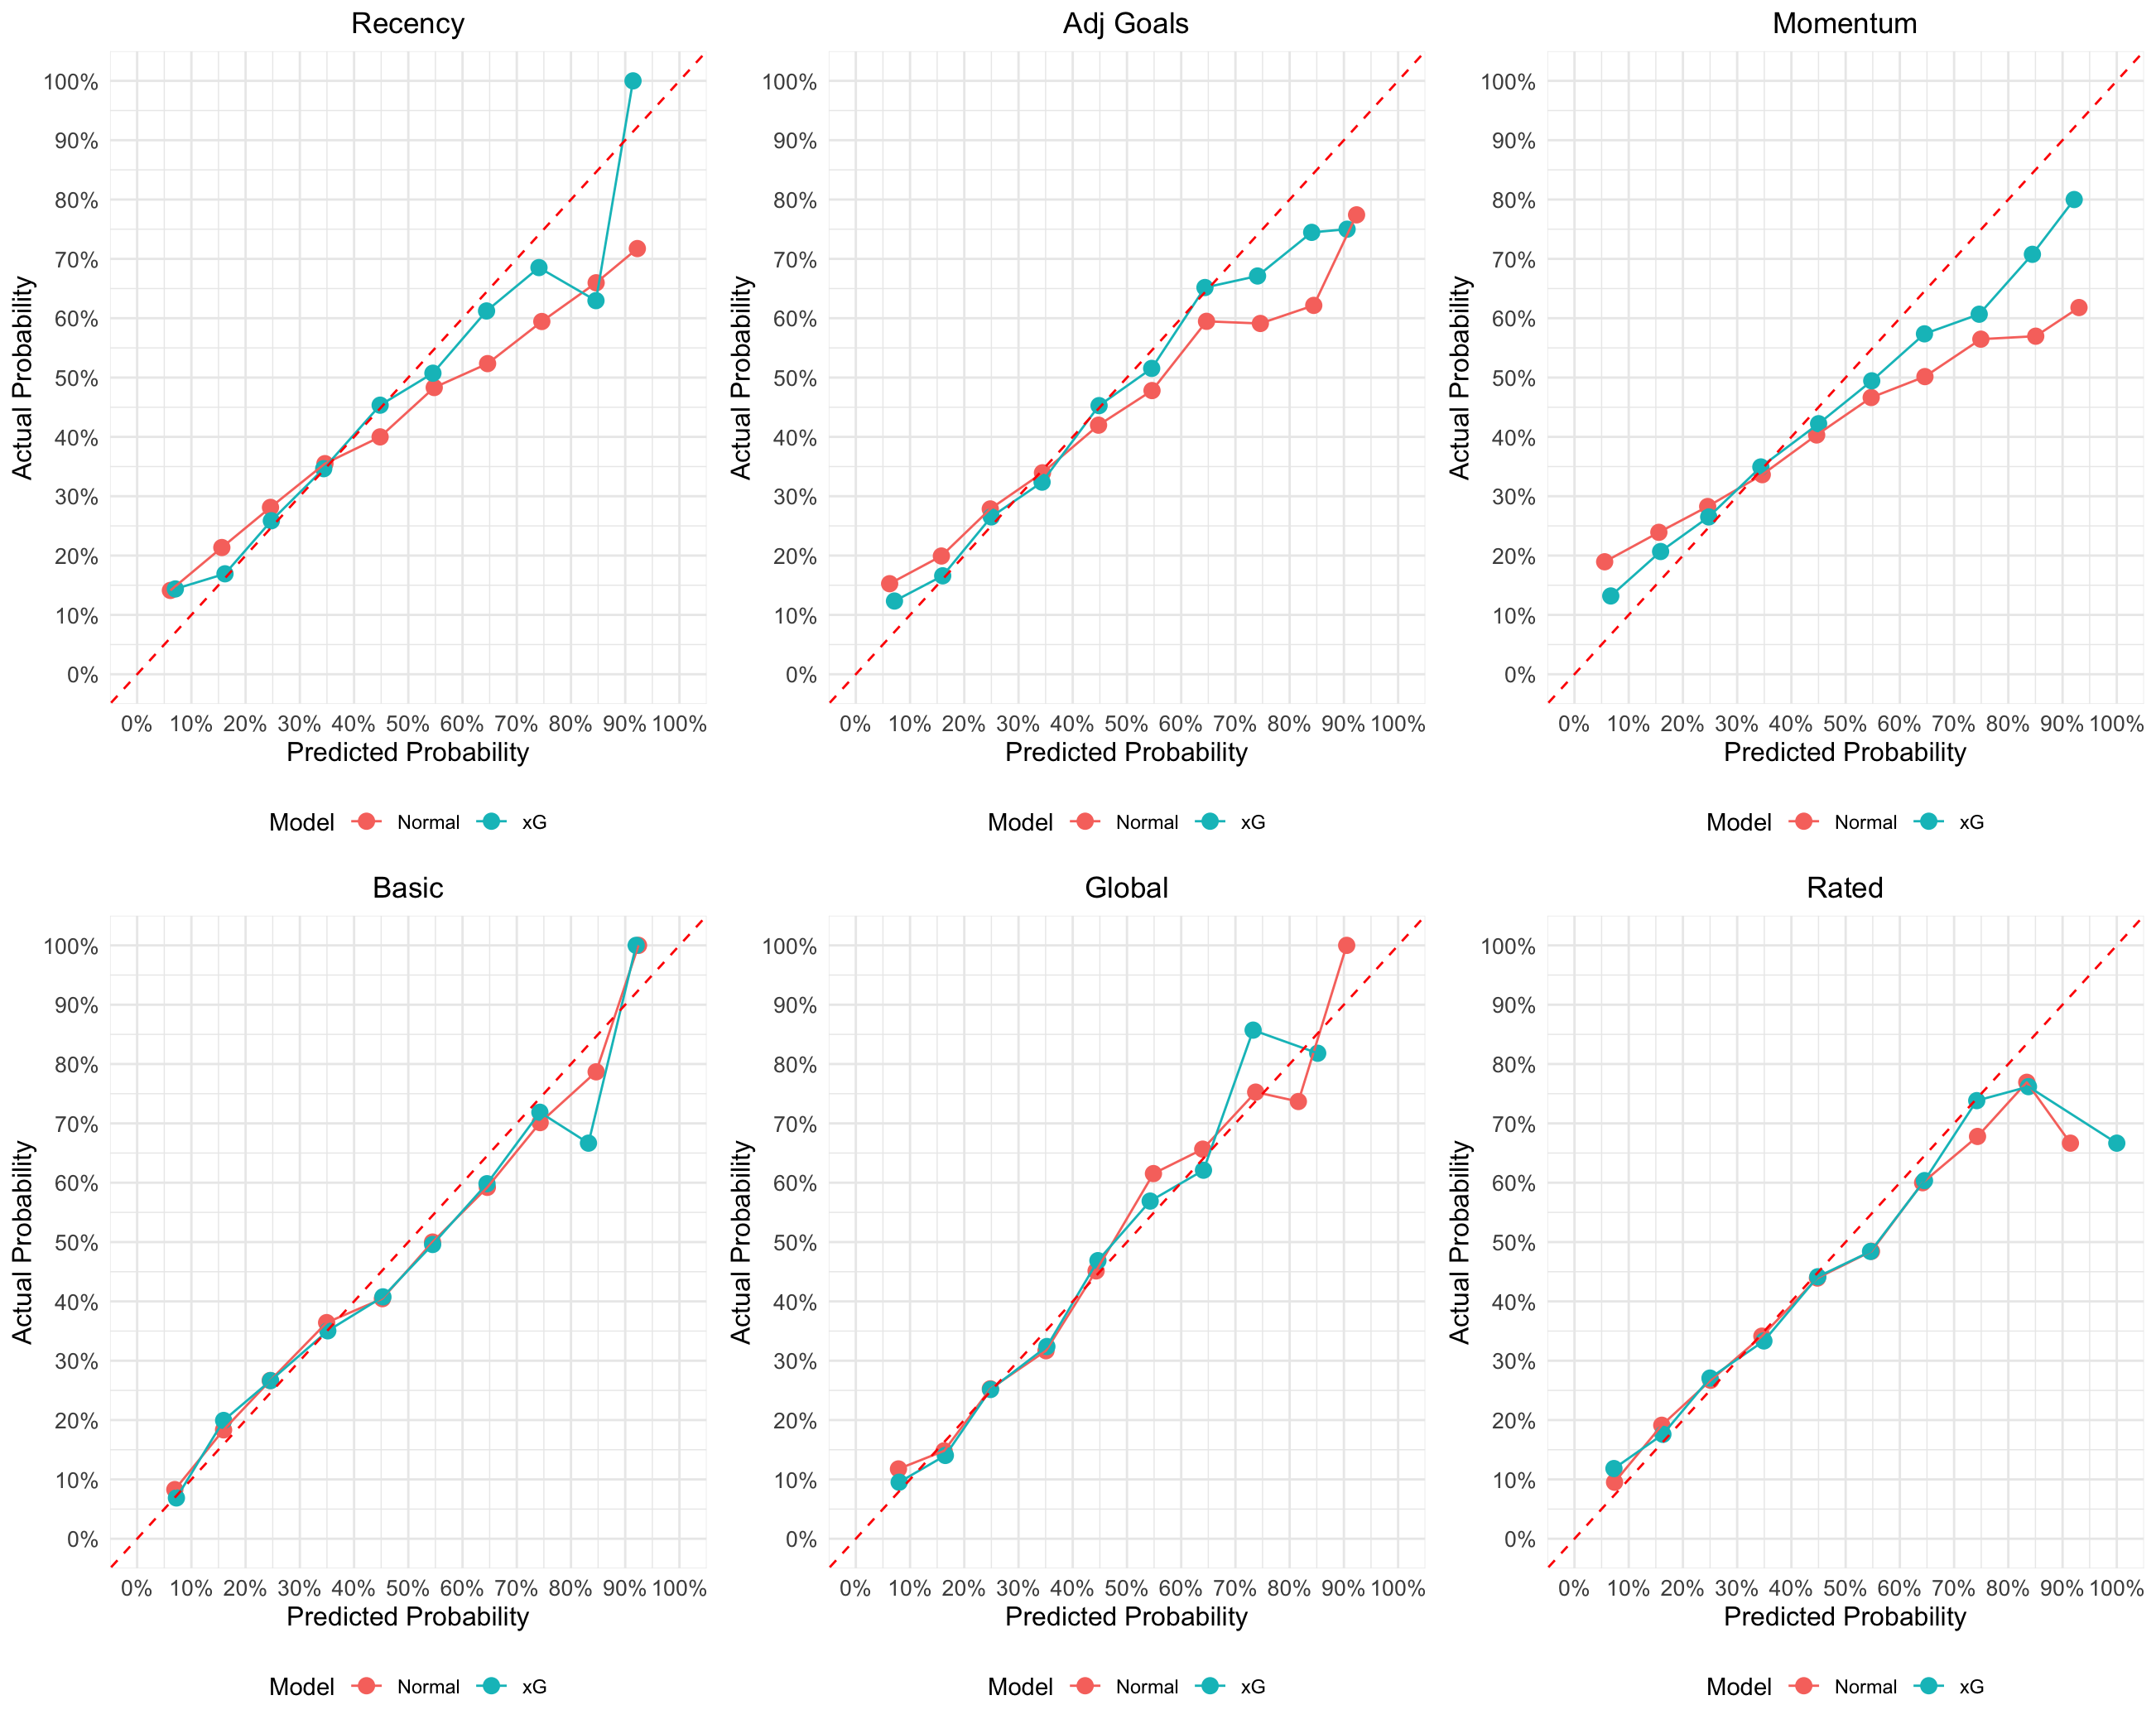
Expected Goals Model Performance Metrics
The following table summarizes the performance of different predictive models. The models have been evaluated based on Log Loss, Brier Score, and Rank Probability Score (RPS). Additionally, we have compared the standard models with their expected goals (xG) counterparts to understand the impact of xG on model performance.
Expected goals (xG) is a metric that measures the quality of a scoring chance based on several factors such as the type of assist, the angle, and the distance to the goal. Using xG metrics improves the accuracy of the model, especially for leagues with a significant history (3 or more years of xG data), as depicted in the charts and the table below:
| Model | Log Loss | Brier Score | Rank Probability Score |
|---|---|---|---|
| Recency | 0.6167301 | 0.2105630 | 0.4350659 |
| Recency.xg | 0.5934173 | 0.2027280 | 0.4151345 |
| Adj Goals | 0.6101010 | 0.2084457 | 0.4299656 |
| Adj Goals.xg | 0.5886517 | 0.2006695 | 0.4097635 |
| Momentum | 0.6540947 | 0.2201641 | 0.4610323 |
| Momentum.xg | 0.6047770 | 0.2070574 | 0.4284204 |
| Basic | 0.5932838 | 0.2029726 | 0.4158680 |
| Basic.xg | 0.5929648 | 0.2028705 | 0.4145138 |
| Global | 0.5885199 | 0.2006487 | 0.4100453 |
| Global.xg | 0.5889827 | 0.2010117 | 0.4105521 |
| Rated | 0.5996256 | 0.2056399 | 0.4244355 |
| Rated.xg | 0.6116805 | 0.2060495 | 0.4255521 |